 Buy Crypto
- Markets
 Futures
- Spot
- Copy Trade
- Earn
- More
Crypto Market Flash Crash: Has the Industry's Four-Year Cycle Come to an End?
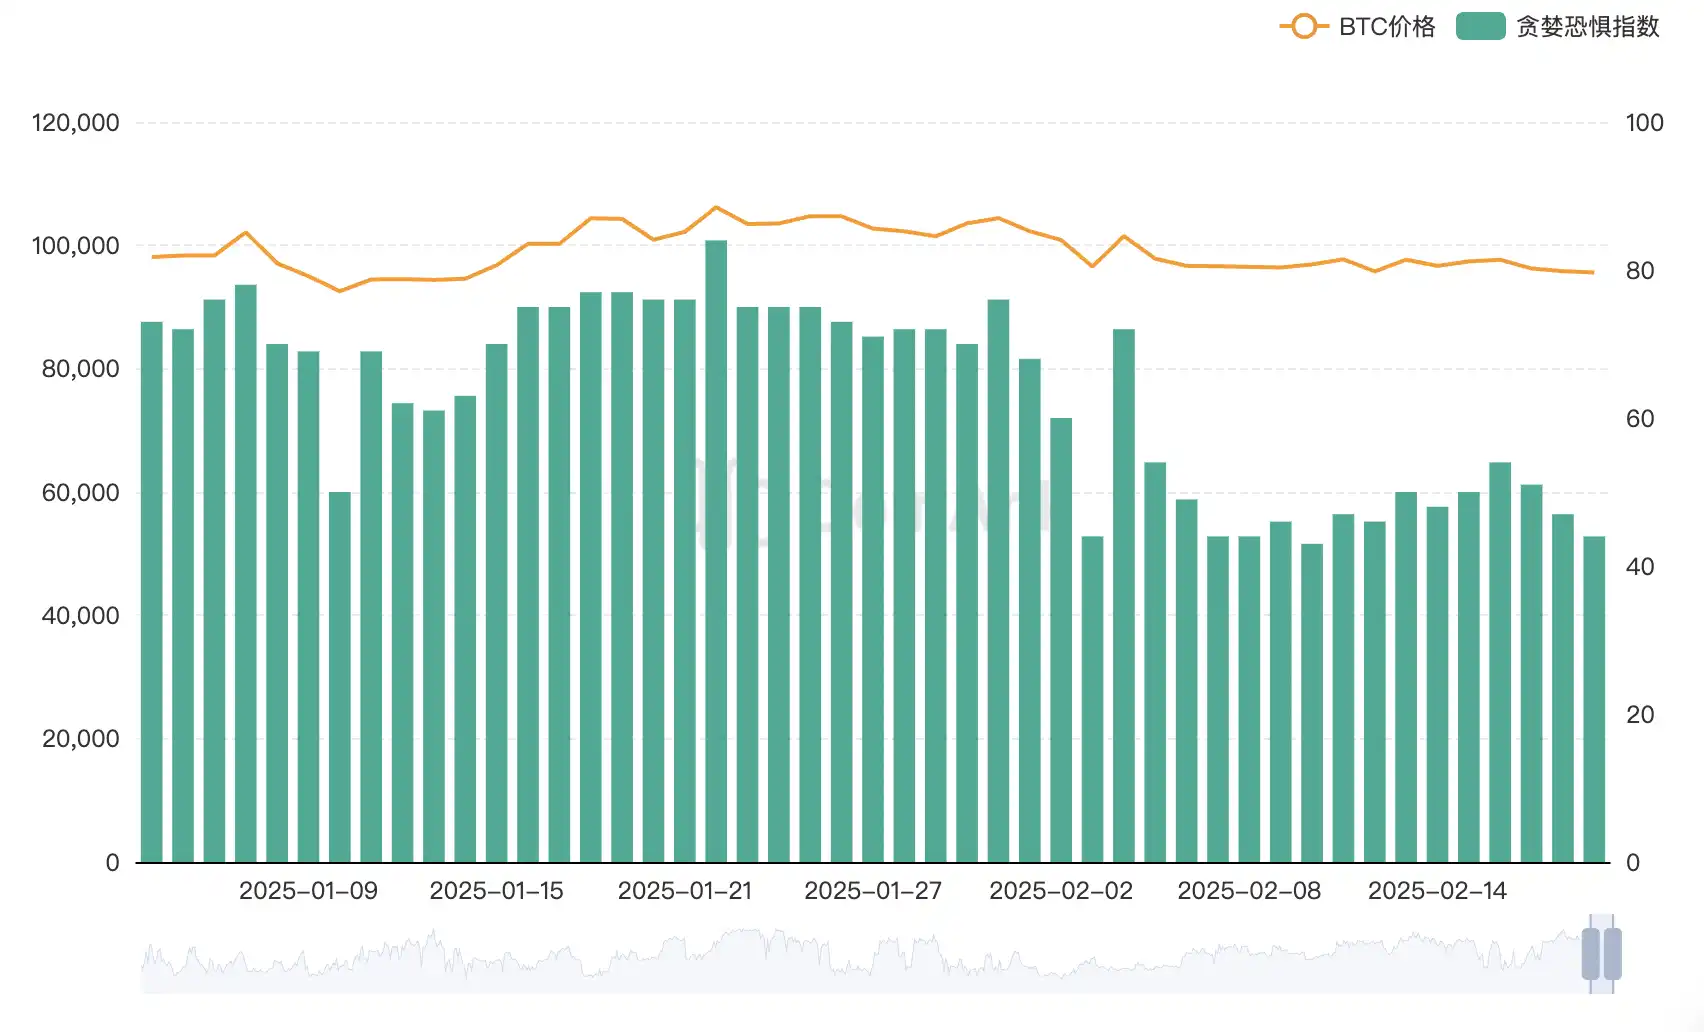
The market experienced a brutal Black Swan event as the Trump administration imposed tariffs on Canada and Mexico. In retaliation, the Mexican and Canadian governments imposed tariffs on the United States, greatly reinforcing the dollar's position. On that day, the BTC price plummeted to a low of $91,500, only to rebound in the evening, breaking through to a high of $102,000 before declining steadily.
Over the past week, BTC has been trading in a narrow range between $94,000 and $99,000. On February 18, during the U.S. trading session, the price quickly dropped to $93,300. A significant whale liquidation also occurred on-chain: a whale was liquidated of $14 million worth of WBTC after BTC broke below $94,000. The Fear and Greed Index has consistently shown a fear sentiment level since February 7.
Not only has trading volume on exchanges continued to shrink, but Binance's BTC spot trading volume on a weekly basis is less than half of the previous week. On-chain transaction data has also been lackluster. In the past 24 hours, only four DeFi tokens on pump.fun have a market value of over $1 million. Protocol revenue has also plummeted, shrinking by nearly 90% from its peak.

The aftermath of the Trump token issuance frenzy continues to impact the cryptocurrency market, with Web2 extracting liquidity to Web3 and causing numerous legal disputes. Social media sentiment is also very pessimistic, with many openly saying, "At this rate, the Web3 industry is done for." Moreover, macroeconomic inflation data in the U.S. continues to rebound. The narrative of interest rate cuts introducing liquidity seems unsustainable. Has this bull market truly come to an end? Let's hear what traders have to say.

Technical Analysis Enthusiast
Although BTC is currently in a safe zone and has not broken through a key support level, the BTC-to-gold exchange rate is in a freefall. After a standard break below a key support level, with multiple failed rebounds to reclaim it, the drop has resumed. The best-case scenario now is for a bottoming out here, followed by a formation of a descending wedge. This could potentially lead to a false breakdown. Otherwise, the gold-based BTC price is likely to precede the USD-based price into a bearish trend.


First of all, it is believed that the current decline has not completed yet. There is no significant support near $93,600, nor is it close to the uptrend line since January and the major level platform support. The rebound strength is not strong, and it still needs to search downwards for larger level support, which may be around $92,000. Then there will be a rapid breakthrough again, with the target roughly at $102,000, followed by a small cycle of distribution and downward fall to around $75,000, forming a large-scale rising wedge. Around May, it is expected to reach around $120,000, marking the end of the bull market.
Currently, BTC appears to have a small-scale violent rebound around the daily MA120 level, which is a correction after the pie's rally. It first touched the daily MA120 level in history, where there will usually be a rebound, large or small. Currently, the first support below the pie is still around the daily MA120 level, which is around $93,200. The first resistance above is around $98,000. It depends on whether the bulls or bears become stronger to break in the opposite direction. If both sides are evenly matched, the pie will continue to oscillate in this narrow space. Altcoins will likely follow the pie in a more volatile manner, with no good trading opportunities.

It is believed that there will be another wave of late-stage market sentiment for the pie, but many people do not understand that in fact, a panic-selling dip is good for the bulls. After all, a panic-selling dip also means missing out on trading opportunities, unlike the current market trend that prevents people from aggressively entering the market.
Data Analysis Enthusiast
Today, the cryptocurrencies with the highest inflow of funds after the dip are BNB, TRX, LTC, TRUMP
Currently, the liquidity has not yet recovered. 93,400 is unlikely to be the bottom. Investors looking to buy the dip should continue to wait for a few more days. The price could range between 91,000 and 89,000.


The stablecoins on exchanges have been steadily increasing, providing some upward momentum. However, there is a lack of confidence in the market for a bullish surge.
Both spot and derivative order books are dominated by sellers. The sell-side order book depth far exceeds the buy-side, indicating a continuous selling pressure.


Macro Analysis Enthusiast
Although the market sentiment isn't very positive today, the ETF data from last Friday was still good. The data for ETH was updated on Sunday and it remained positive. Similarly, the data for BTC was also favorable, showing a net inflow. Notably, Bitcoin saw net outflows throughout the week, with only Friday showing net inflows, albeit in small quantities.
We discussed this issue in the past few days. Whether it's inflow or outflow, the amounts are insignificant, indicating that investors' sentiments are not extreme. There's neither a strong bullish nor bearish sentiment. Most investors are taking a wait-and-see approach, and even the few trades that are happening are mainly in grayscale, BlackRock, and Fidelity.

Looking at BTC's on-chain data,
We can see that the recent price drop of BTC, possibly due to user sentiments or cascade liquidations, even breaking below $94,000, has not triggered panic among investors based on the data. In fact, BTC's on-chain turnover is lower than yesterday, indicating that such low turnover is not indicative of widespread institutional selling.
Moreover, based on the data, the exit of loss-making investors accounted for nearly 70% of the total turnover, making it even less likely to be due to institutional selling. The main reason is that between $93,000 and $98,000, there was no significant sign of mass selling by investors, indicating very strong support.


Views on Other Altcoins

Sol has currently dropped to the support level of a major trend line, but it is worth noting that the daily MACD is below the equilibrium line; the indicator shows a slight divergence. The current downward trend is due to the negative expectation of a large unlock, which has not yet occurred. The actual impact of the unlock on SOL's price will determine whether the negative sentiment will turn positive, as the unlock could potentially mark the beginning of a real negative trend.
The current market trend does not provide a clear trading strategy, and there is no directional trading plan. If you must trade, you can only engage in small-scale trading within a narrow range. The best scenario would be to see a downward break in late February or early March to establish a solid entry point;
Regarding Sol's unlock, I believe it will have a two-fold impact:
First is the emotional impact, which is undeniable. Indeed, on March 1st, there will be a large amount of SOL unlocked, not just on this fixed date but actually starting from February in a linear unlock process. The average cost basis of these chips is around $70. (Galaxy Digital's cost basis is $64, while other institutions' is $94, but Galaxy Digital acquired two-thirds of them)
However, it's important to note that only about 35% will be unlocked this time, so even if these institutions decide to dump all their SOL, it could indeed create a significant drop, but it might result in losses for the institutions. If institutions do decide to sell, they could easily do it through OTC rather than directly crashing the market. Therefore, personally, I think such concerns are somewhat overstated. Even if OTC trading would still impact the market, institutions are not foolish; they aim to maximize profits rather than crash the price in one go, especially considering there is still a significant amount yet to be unlocked.
From a personal perspective on the second part, the likelihood of a crash due to massive selling seems very low. Even MicroStrategy's purchases were conducted through OTC to avoid affecting the market. The noticeable aspect is that SOL's decline occurred mostly during the Asian trading session, while it stabilized during the U.S. trading session.
You may also like
BTC Firm Above 70K! Saylor’s "Institutional Logic" vs. Moon’s "Retail Faith": Who is Really Harvesting the Market?
Bitcoin is holding firm above the $70,000 support level following a massive short squeeze that liquidated $427 million. As the "Four-Year Cycle" narrative shifts, the market is split: Michael Saylor’s cold, institutional "indiscriminate stacking" vs. Carl Moon’s high-energy retail "hopium." This article decodes these two polar-opposite strategies for the 2026 bull run and reveals how WEEX’s institutional-grade liquidity and AI trading tools empower every type of investor to convert market volatility into profit.

The Girl Who Created the SBTI Test: A Story of a Doomed Cyber Love, an E-Widow Ratfolk

B.AI Officially Launched: Building AI Agent Financial Bedrock Platform, Driving AGI Era Business Underlying Logic

B.AI Officially Launched: Breaking Down A2A Collaboration Barriers to Unlock the Smart Body Economy's Full Potential

We helped Xu Mingxing write a book called "<OK Life>".

Rare APY of 400%, is TradeXYZ handing out money to oil bulls?
a16z: Perpetual Contracts are Rewriting Global Trading Rules

Bitcoin Hits $73,000 Triggering $427M Short Liquidation | Carl Moon: $200,000 is the Target
April 9, 2026 (UTC+0), 22:17. Bitcoin (BTC) executed a high-velocity surge within minutes, heavy-hitting the $73,000 psychological barrier and touching a local high near $74,000. While the price has since retraced to consolidate above $72,000, this "instant ambush" successfully completed a $427M liquidation of short positions.

a16z partner: perpetual contracts are rewriting the global trading rules
Bitcoin ETF Inflows Just Turned Positive After 5 Months of Outflows: What Does That Mean for BTC Price Now?
The Hidden Risks Behind Bitcoin ETF Inflows in 2026: What Traders Should Know. The question now isn't whether inflows are happening. It's what they're telling you about the next phase and whether your portfolio is positioned for it.
Decoding 2026's Bitcoin ETF Data: How to Trade Alongside Institutional Smart Money in 2026
After months of sustained outflows, rolling 30-day net ETF inflows just crossed 30,000 BTC. That's not noise. Historically, when institutional capital rotates back in at this scale, it marks a regime shift — not just a bounce.
Auto Earn Bonus 2026: WEEX vs Binance vs Bybit vs OKX vs Kraken (Only 1 Pays Extra)
Auto Earn 2026: Binance? Bybit? No extra bonus. Only WEEX gives +0.5% + 300% APR referral. Limited-time. See exactly how much more you can earn.

Auto Earn 2026: WEEX Offers 0.5% Extra + 300% APR Bonus — More Than Binance & Bybit?
Most exchanges offer Auto Earn, but only WEEX adds an extra 0.5% bonus on balance growth + 300% APR referral rewards in 2026. Here’s how WEEX compares to Binance, Bybit, OKX, and Kraken — and why you might earn more with a simple toggle.

Seven Green Candles Meet Three White Soldiers | Rewire News Morning Brief

Gold Revisits $4800, Where Is the Top This Year?

Anthropic's Earth's Most Powerful AI So Strong It Made Wall Street Hold Emergency Meeting, But JPMorgan Was Missing Its "Antidote"

Why did Covenant AI flee from Bittensor?

March Exchange Rankings: Market Shrinks Overall, Spot Trading Volume Sees Rare Over 20% Decline
BTC Firm Above 70K! Saylor’s "Institutional Logic" vs. Moon’s "Retail Faith": Who is Really Harvesting the Market?
Bitcoin is holding firm above the $70,000 support level following a massive short squeeze that liquidated $427 million. As the "Four-Year Cycle" narrative shifts, the market is split: Michael Saylor’s cold, institutional "indiscriminate stacking" vs. Carl Moon’s high-energy retail "hopium." This article decodes these two polar-opposite strategies for the 2026 bull run and reveals how WEEX’s institutional-grade liquidity and AI trading tools empower every type of investor to convert market volatility into profit.