 Buy Crypto
- Markets
 Futures
- Spot
- Copy Trade
- Earn
- More
Oil Price Surges Above $100, Yield Curve Inverts: U.S. Bonds Have Already Told the Market What Is Coming
Since the closure of the Strait of Hormuz on March 2, around 17.8 million barrels per day of global oil flow has been disrupted. In the month of March, Brent surged by nearly 60% and WTI by about 53%. This is the steepest monthly gain for the Brent contract since its inception in 1988, surpassing the 46% record set during the Gulf War in 1990.
Normally, a sharp rise in oil prices would push up inflation expectations, and bond yields should follow suit. For most of the past two decades, oil prices and 10-year U.S. Treasury yields have indeed been positively correlated. However, this time, they moved in the opposite direction.
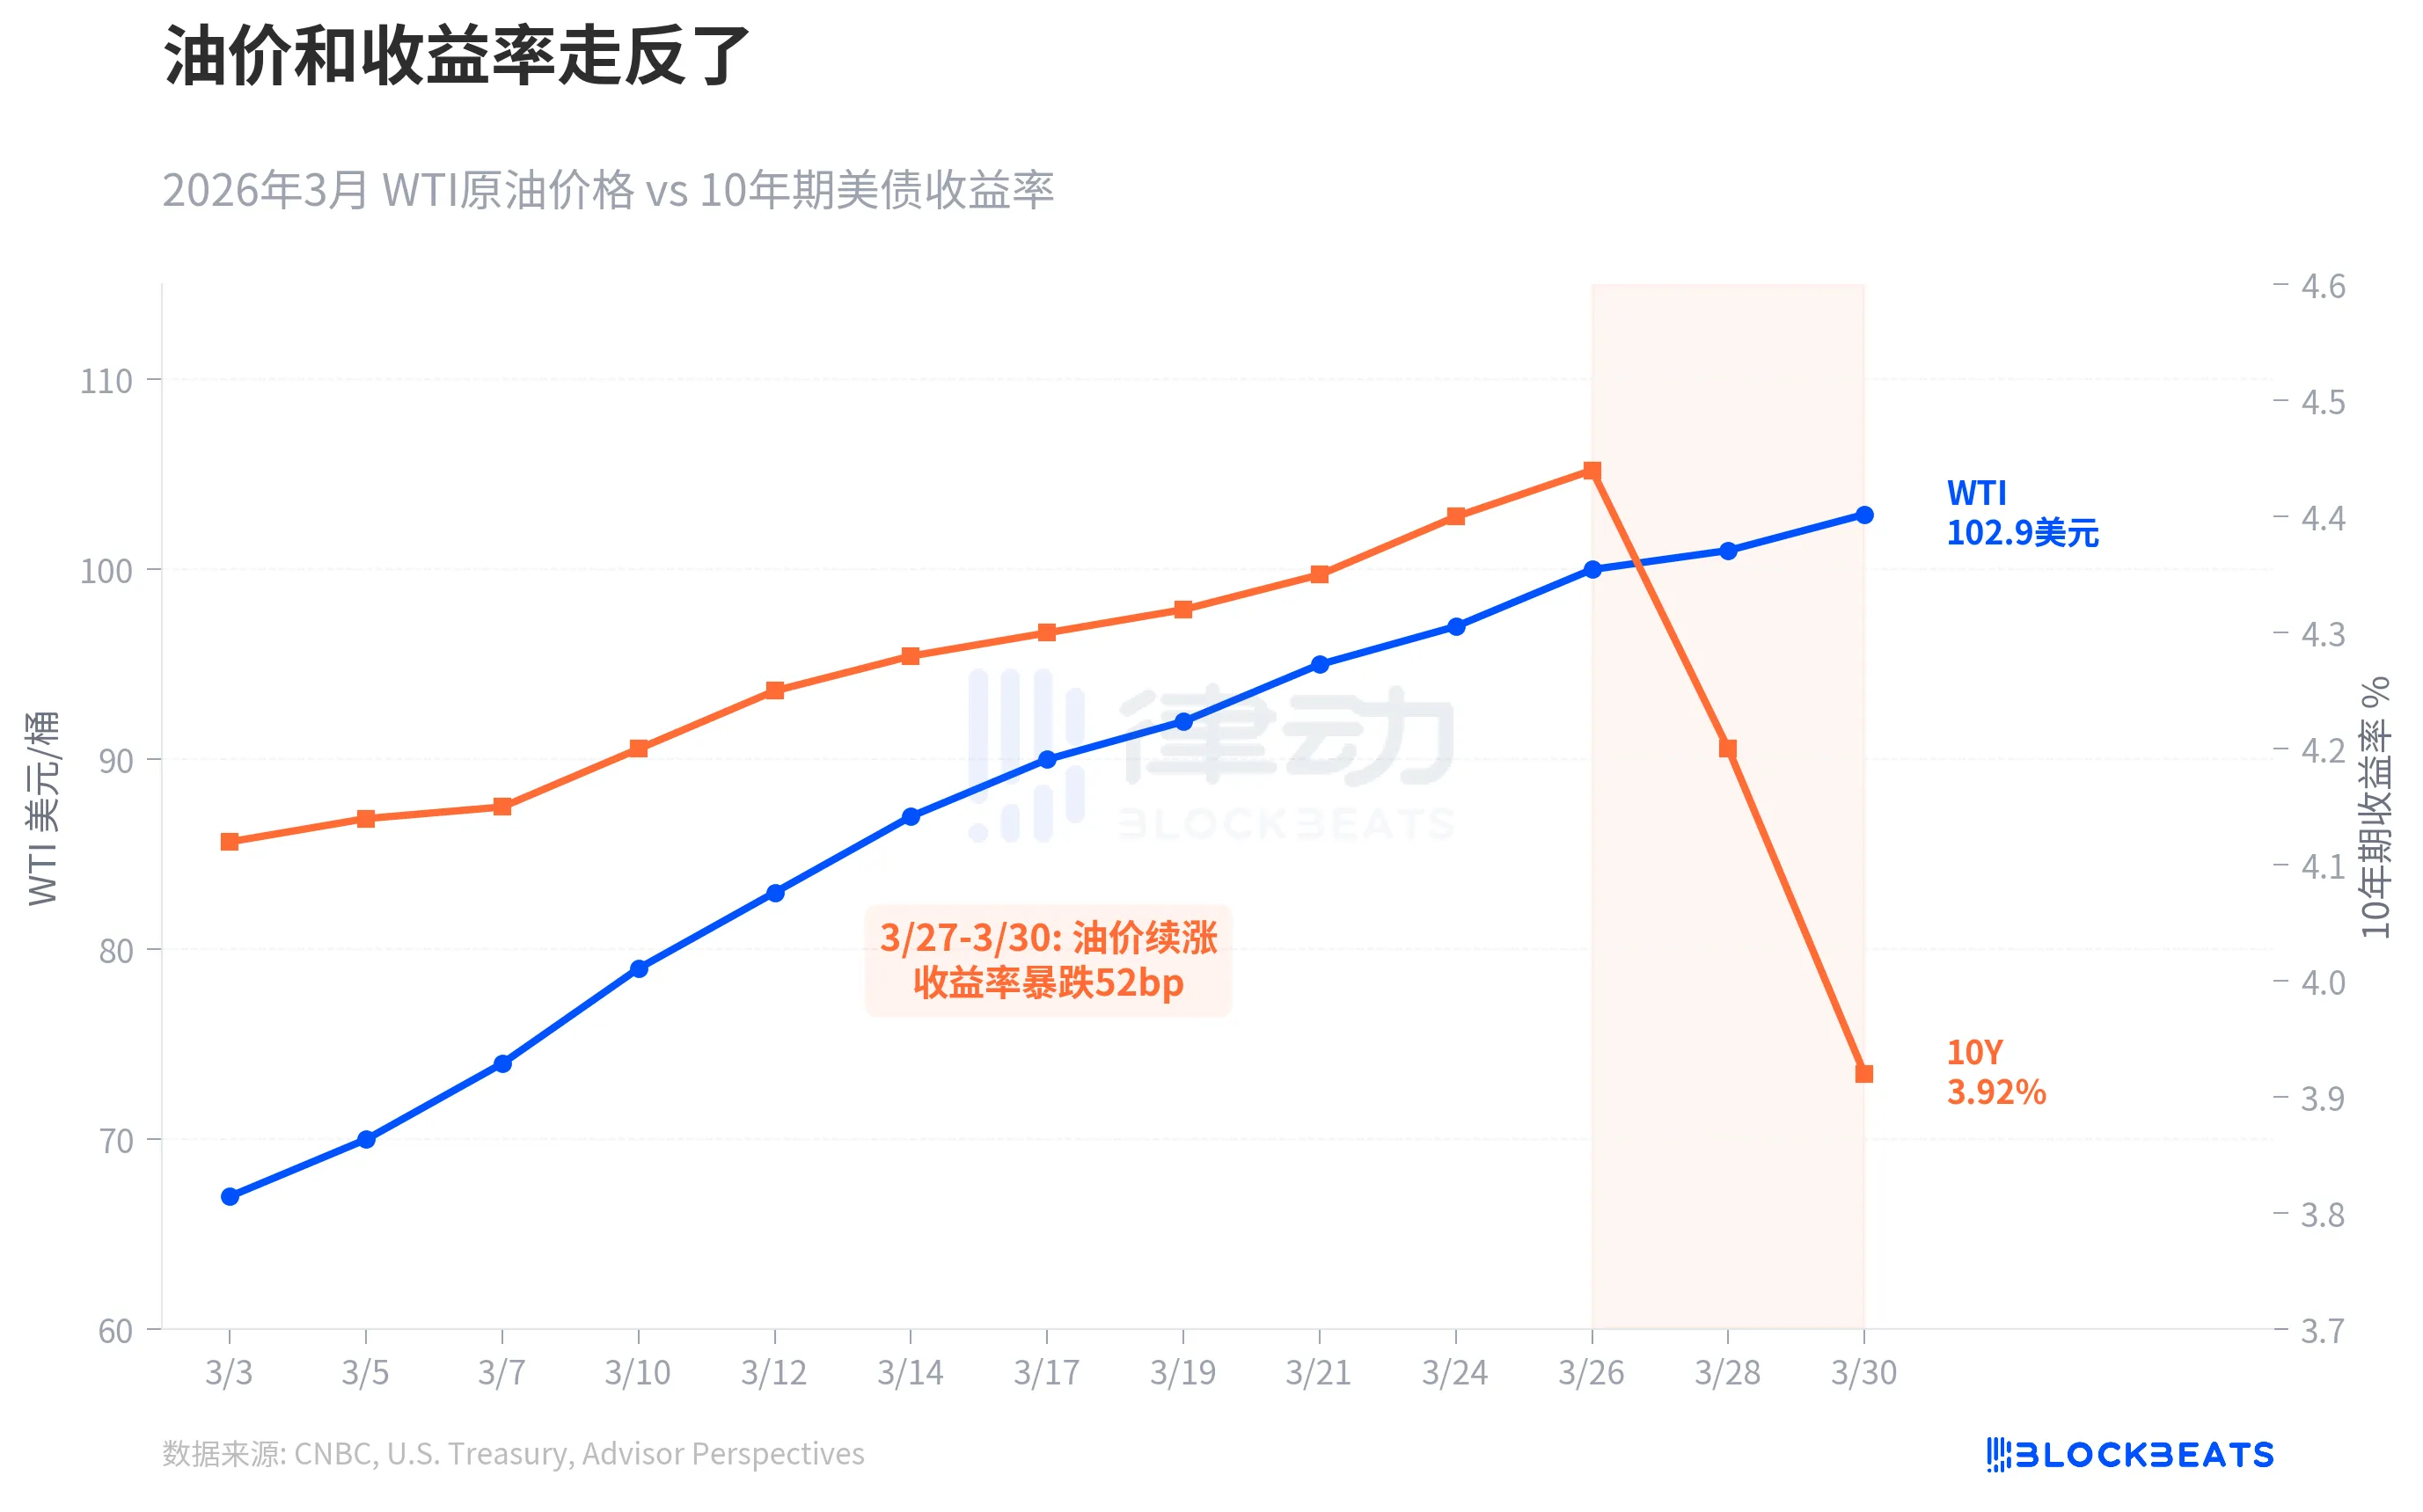
In the first three weeks of March, both were still moving up in tandem. WTI rose from $67 to $100, and the 10-year yield climbed from 4.15% to 4.44%. The turning point occurred between March 27 and 30: while oil prices continued to soar, the yield plummeted from 4.44% to 3.92% in three trading days, a 52 basis point drop breaching the psychologically important 4% level.
This was a typical "flight-to-safety" move, with the bond market making a judgment call: the risks to growth have outweighed the risks of inflation. In the words of the economic research firm Oxford Economics, "risks to economic growth are starting to outweigh risks to inflation." In other words, the market is not no longer afraid of inflation but is more afraid of a recession.
This kind of decoupling is not common, but whenever it occurs, the subsequent story is not usually a good one.
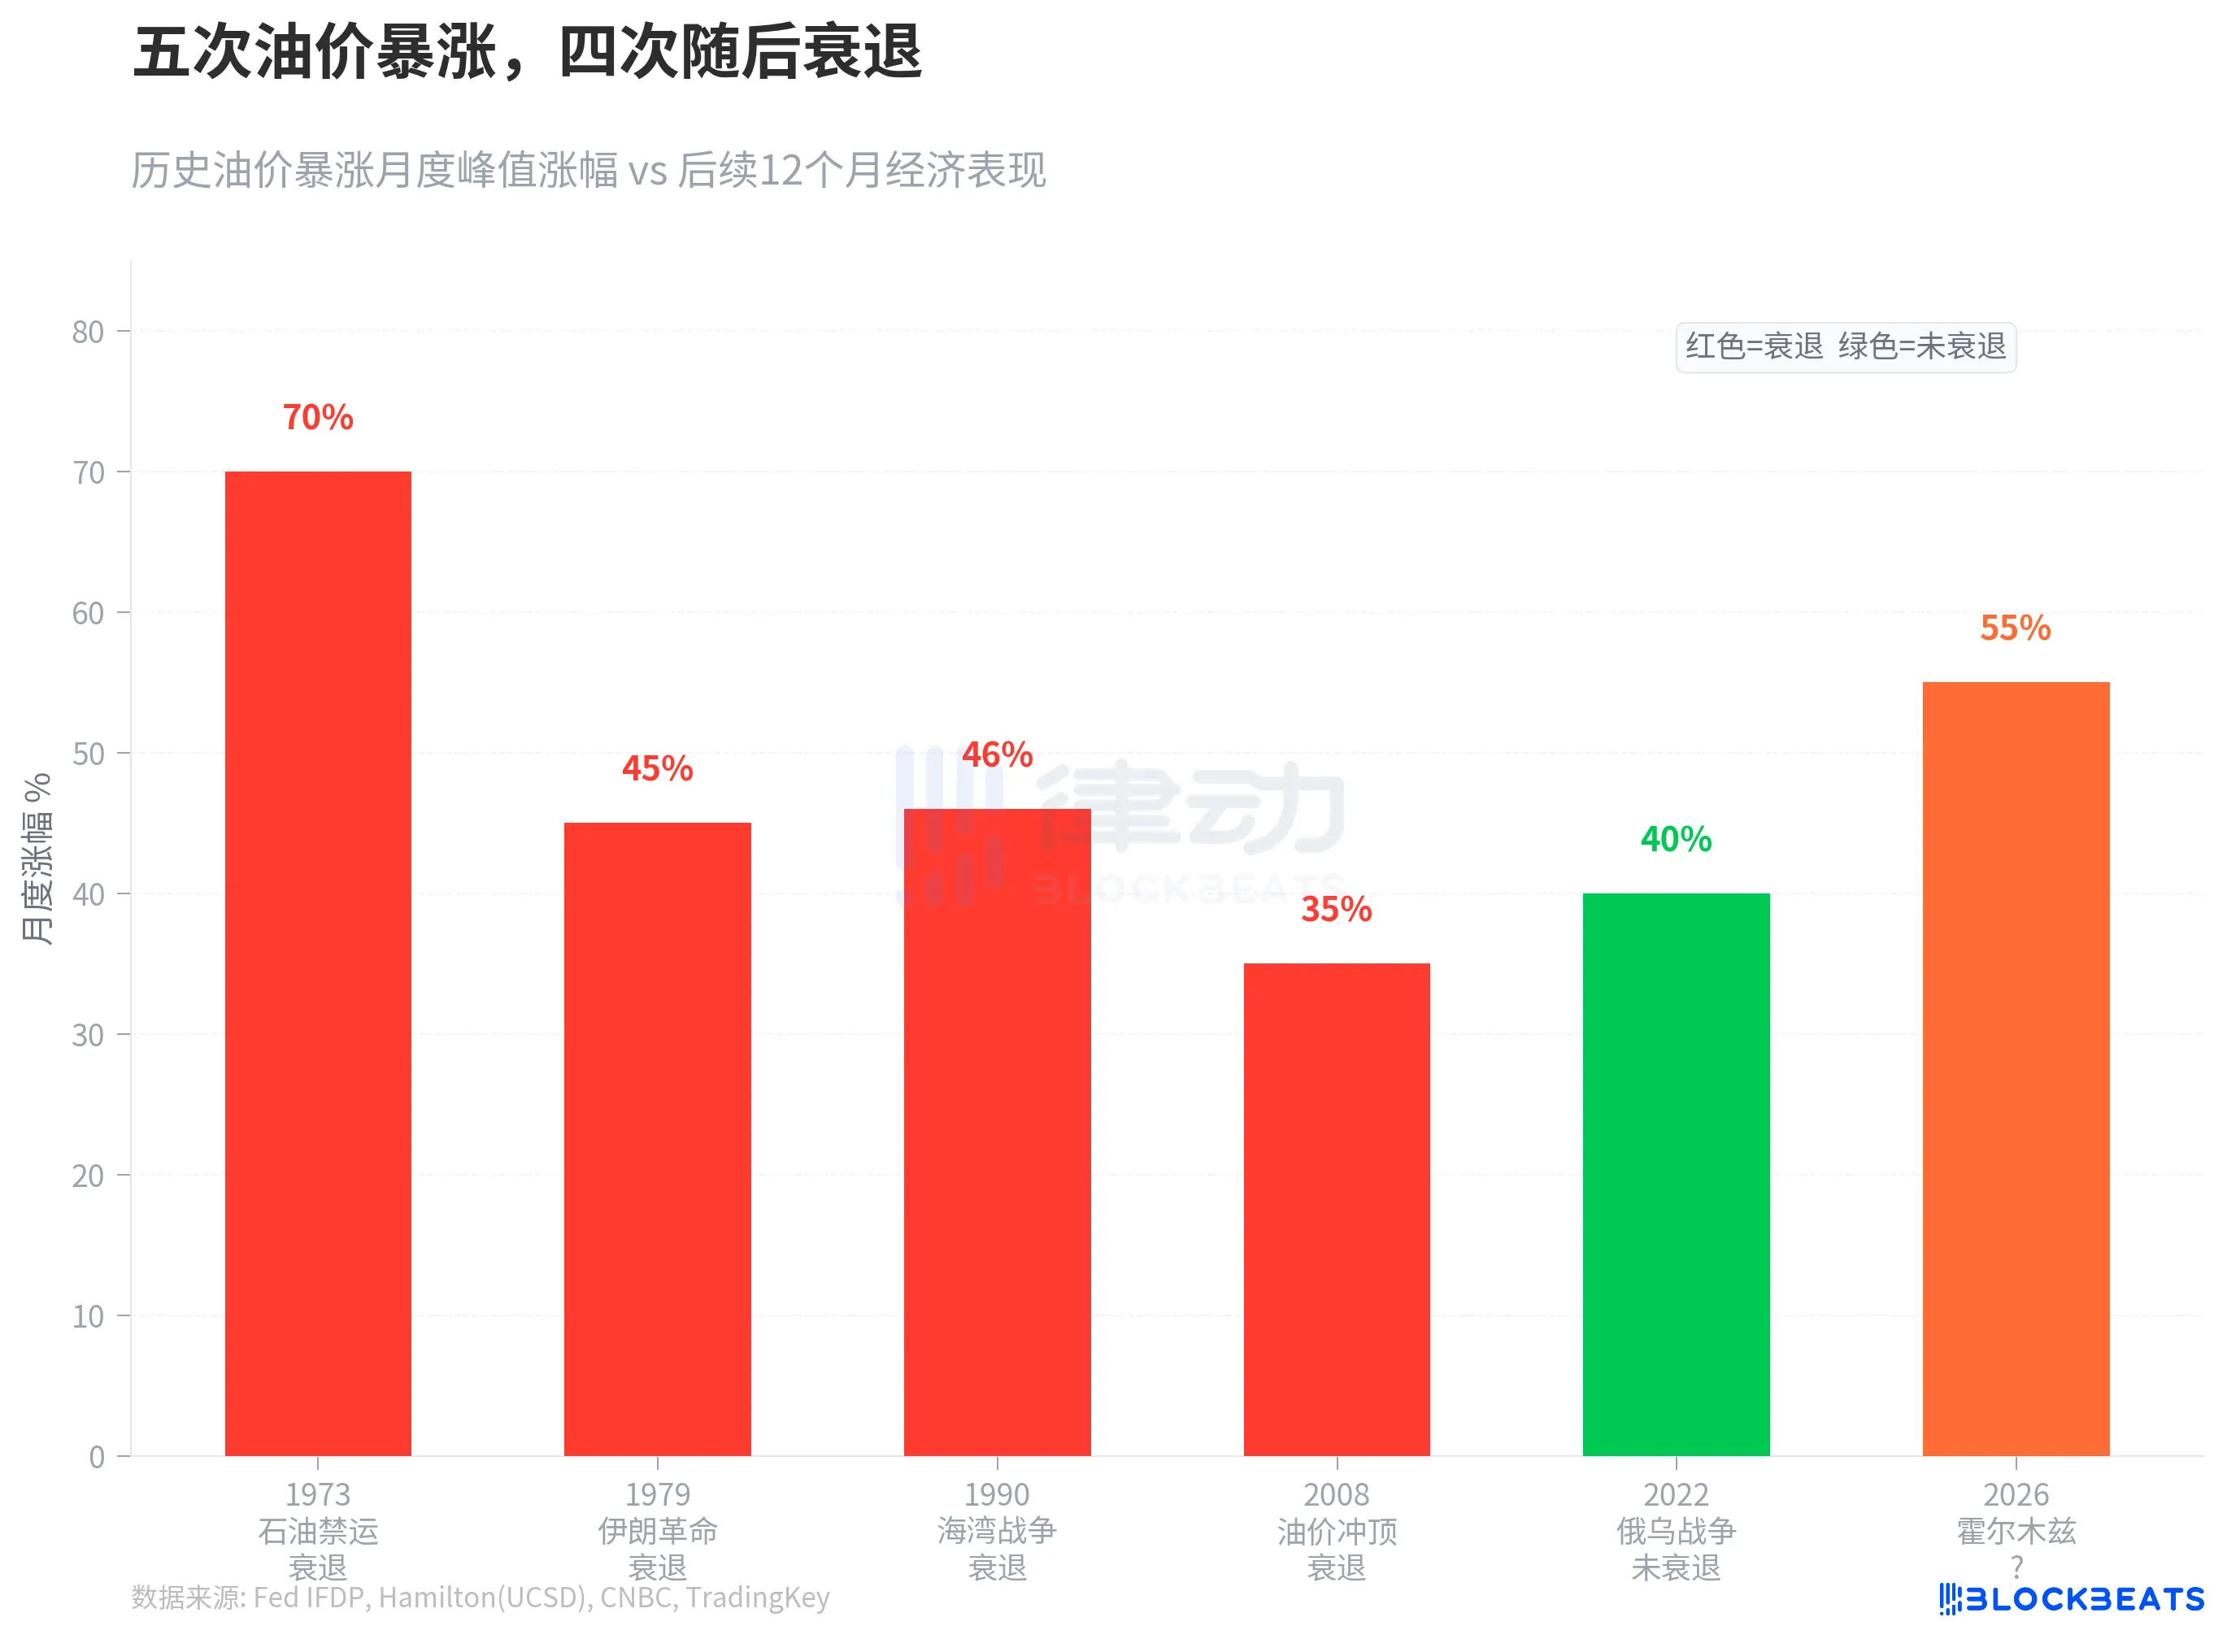
There have been five instances in the past half-century where oil prices surged by over 35% in a short period. In 1973, following the oil embargo, the U.S. GDP fell by 4.7%. In 1979, after the Iranian Revolution, global GDP deviated from trend growth by 3 percentage points. In 1990, during the Gulf War, the U.S. briefly entered a recession. In 2008, oil prices peaked at $147, and although the main cause of that recession was the financial crisis, the oil price shock accelerated the economic downturn. The only exception was the oil price surge driven by the Russia-Ukraine war in 2022, which did not trigger a recession but came with the cost of the most severe inflation in 40 years.
The surge in March 2026 exceeds all of the aforementioned cases. According to research by Federal Reserve economist James Hamilton, there is no mechanical link between oil price shocks and recessions, but "the greater the net rise in oil prices, the more pronounced the restraint on consumption and investment." Goldman Sachs has raised the U.S. recession probability to 30%, while the consulting firm EY-Parthenon puts it at 40%.
The market's reaction speed is also remarkably fast.
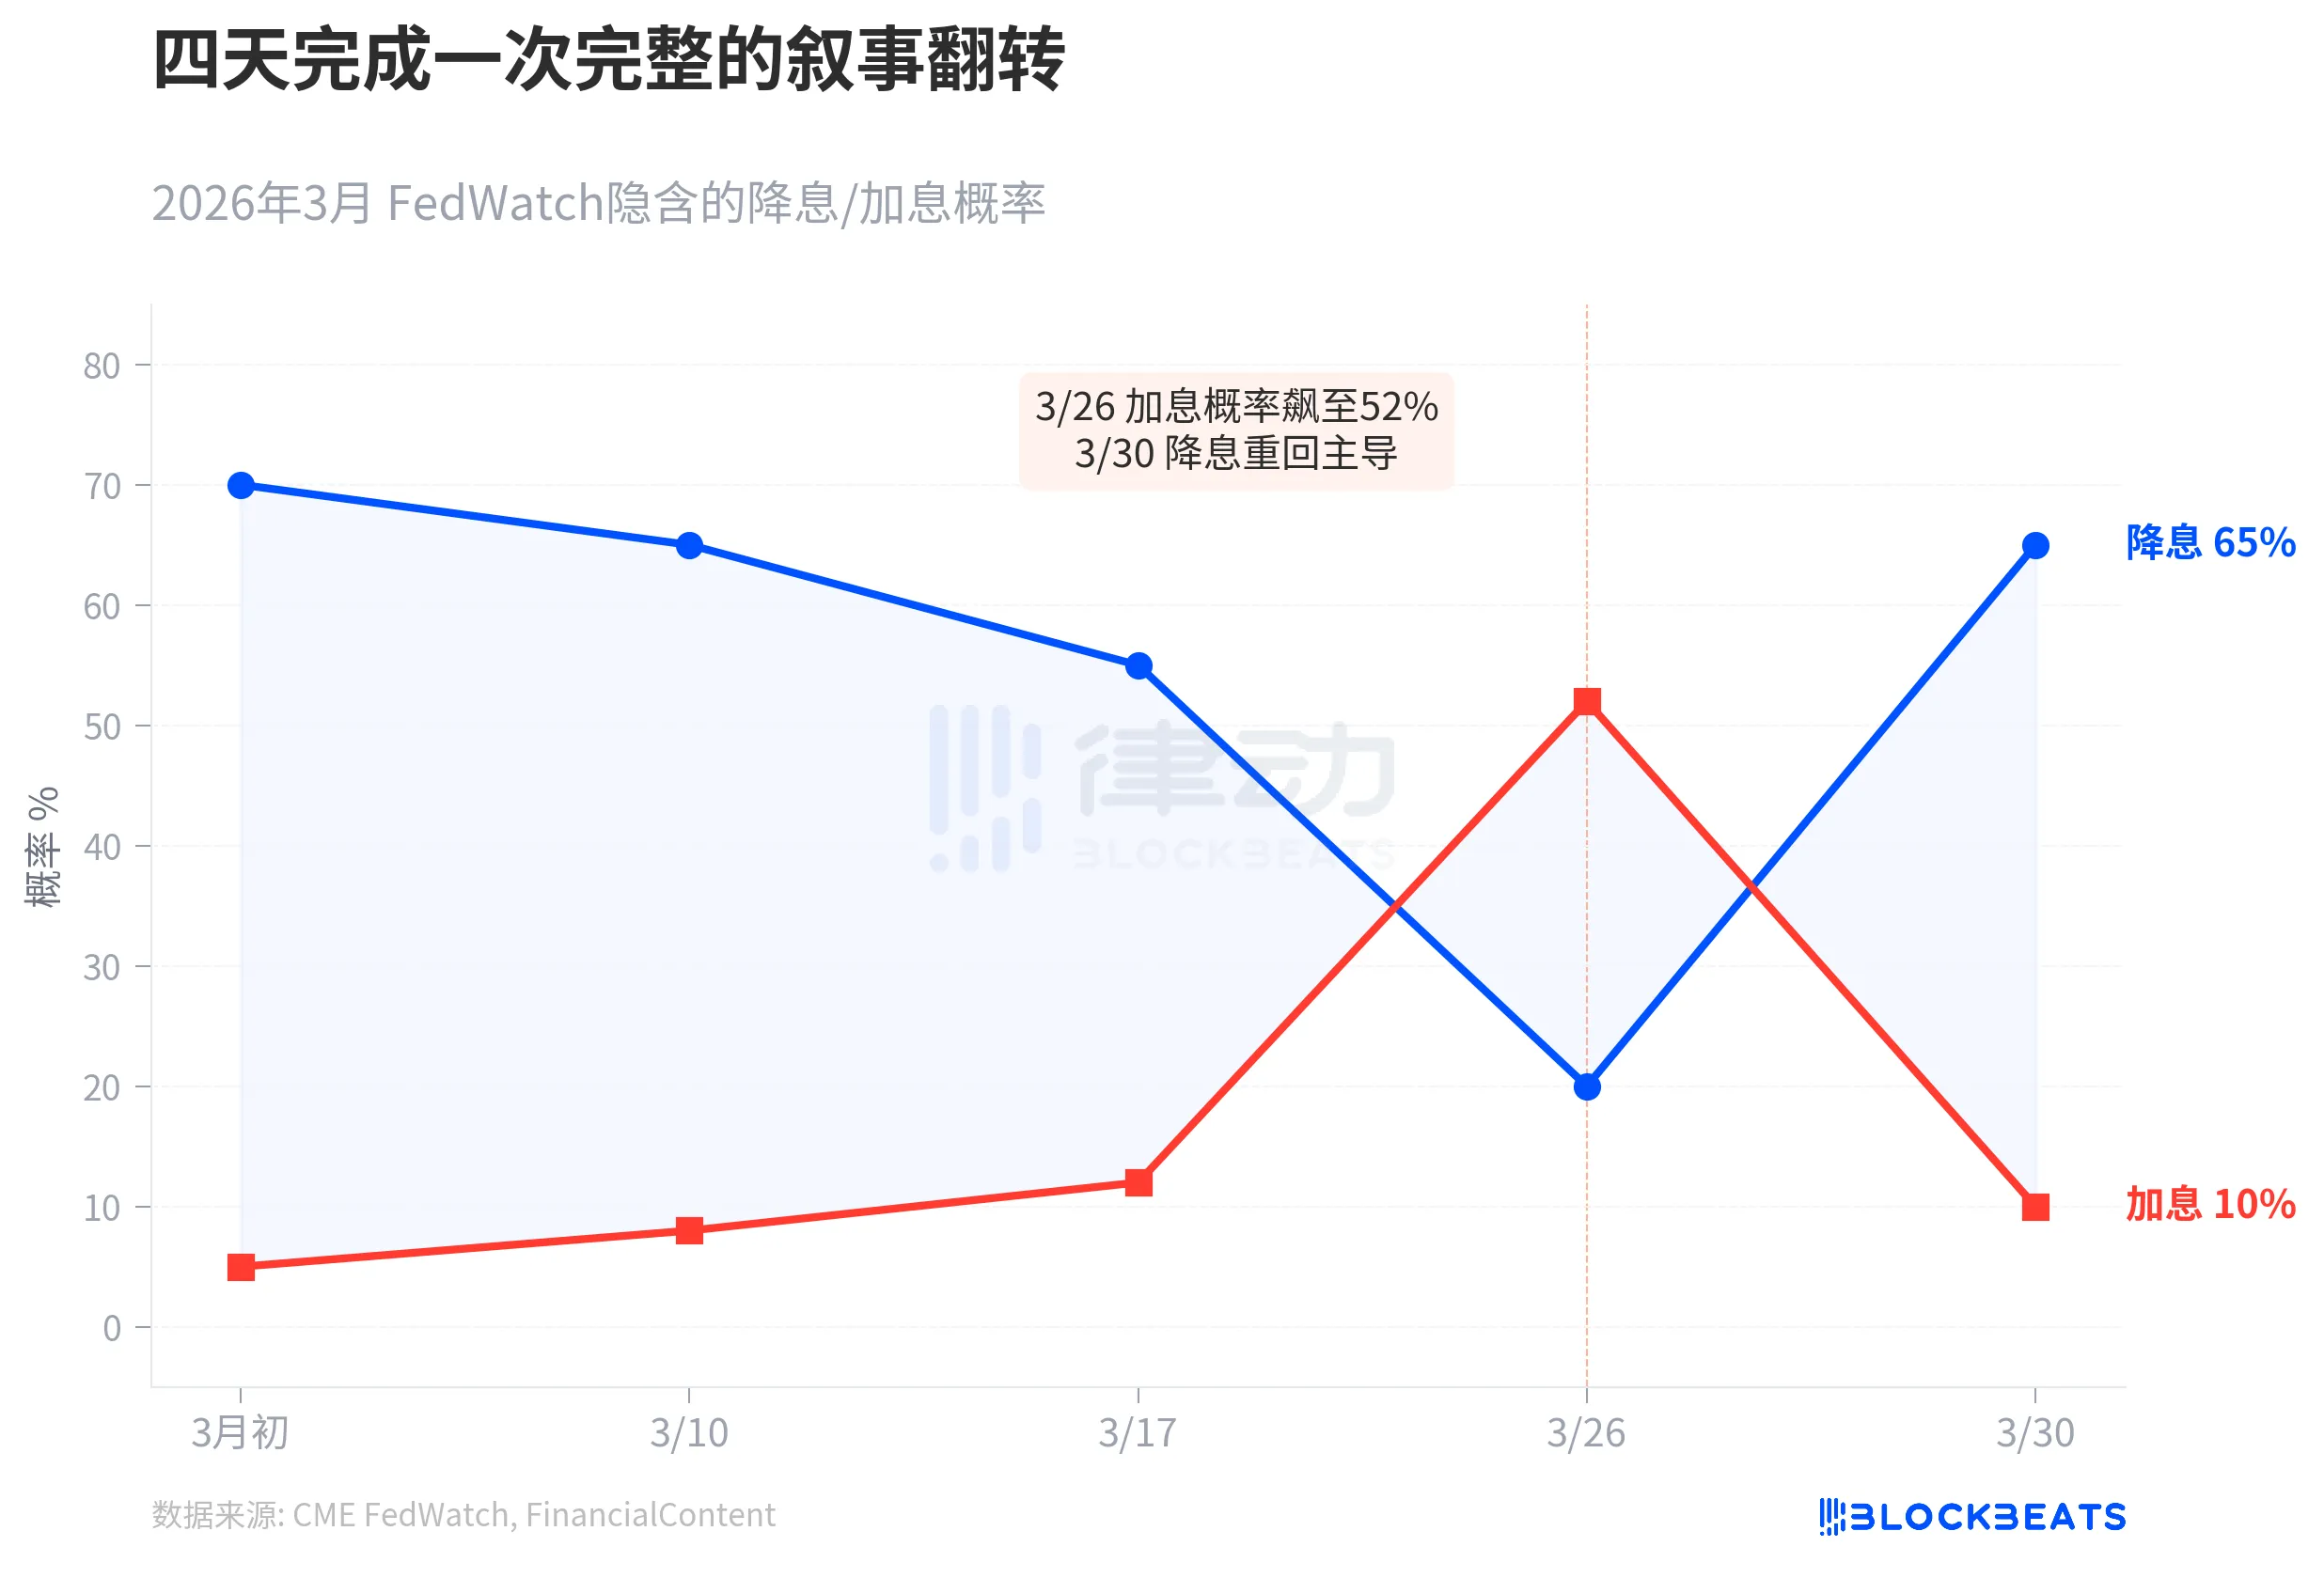
At the beginning of March, CME FedWatch indicated the market expected three interest rate cuts throughout the year, with a 70% probability of a cut in June. Then, oil prices kept rising, with the U.S. import price index jumping 1.3% on March 26, and Federal Reserve Chair nominee Kevin Warsh suggesting the neutral interest rate might be higher. On that day, the probability of a rate hike within the year surged to 52%, and the 10-year yield touched 4.35%. FinancialContent defined this day as "The Great Hawkish Pivot."
Four days later, the narrative completely flipped. On March 30, consumer confidence data plunged significantly, manufacturing unexpectedly contracted, and the 10-year yield plummeted to 3.92%. According to FinancialContent, the market's bet on the Fed's dovish turn in May rose to 65%. Goldman Sachs said the market had bet against a rate hike. Powell, speaking to undergraduates at Harvard University that day, said the Fed "has not yet reached the point where it needs to decide whether to look through the war shock," but emphasized that "anchoring of inflation expectations is key."
According to Axios, Powell's statement was interpreted by the market as follows: the Fed neither wants to hike rates to fight inflation nor is in a hurry to cut rates to aid the economy but is waiting to see if this supply shock is temporary or persistent. However, the bond market couldn't wait.
If history is any guide, Citi strategist McCormick put it most bluntly: stagflation lies ahead, bad for bonds, bad for stocks.
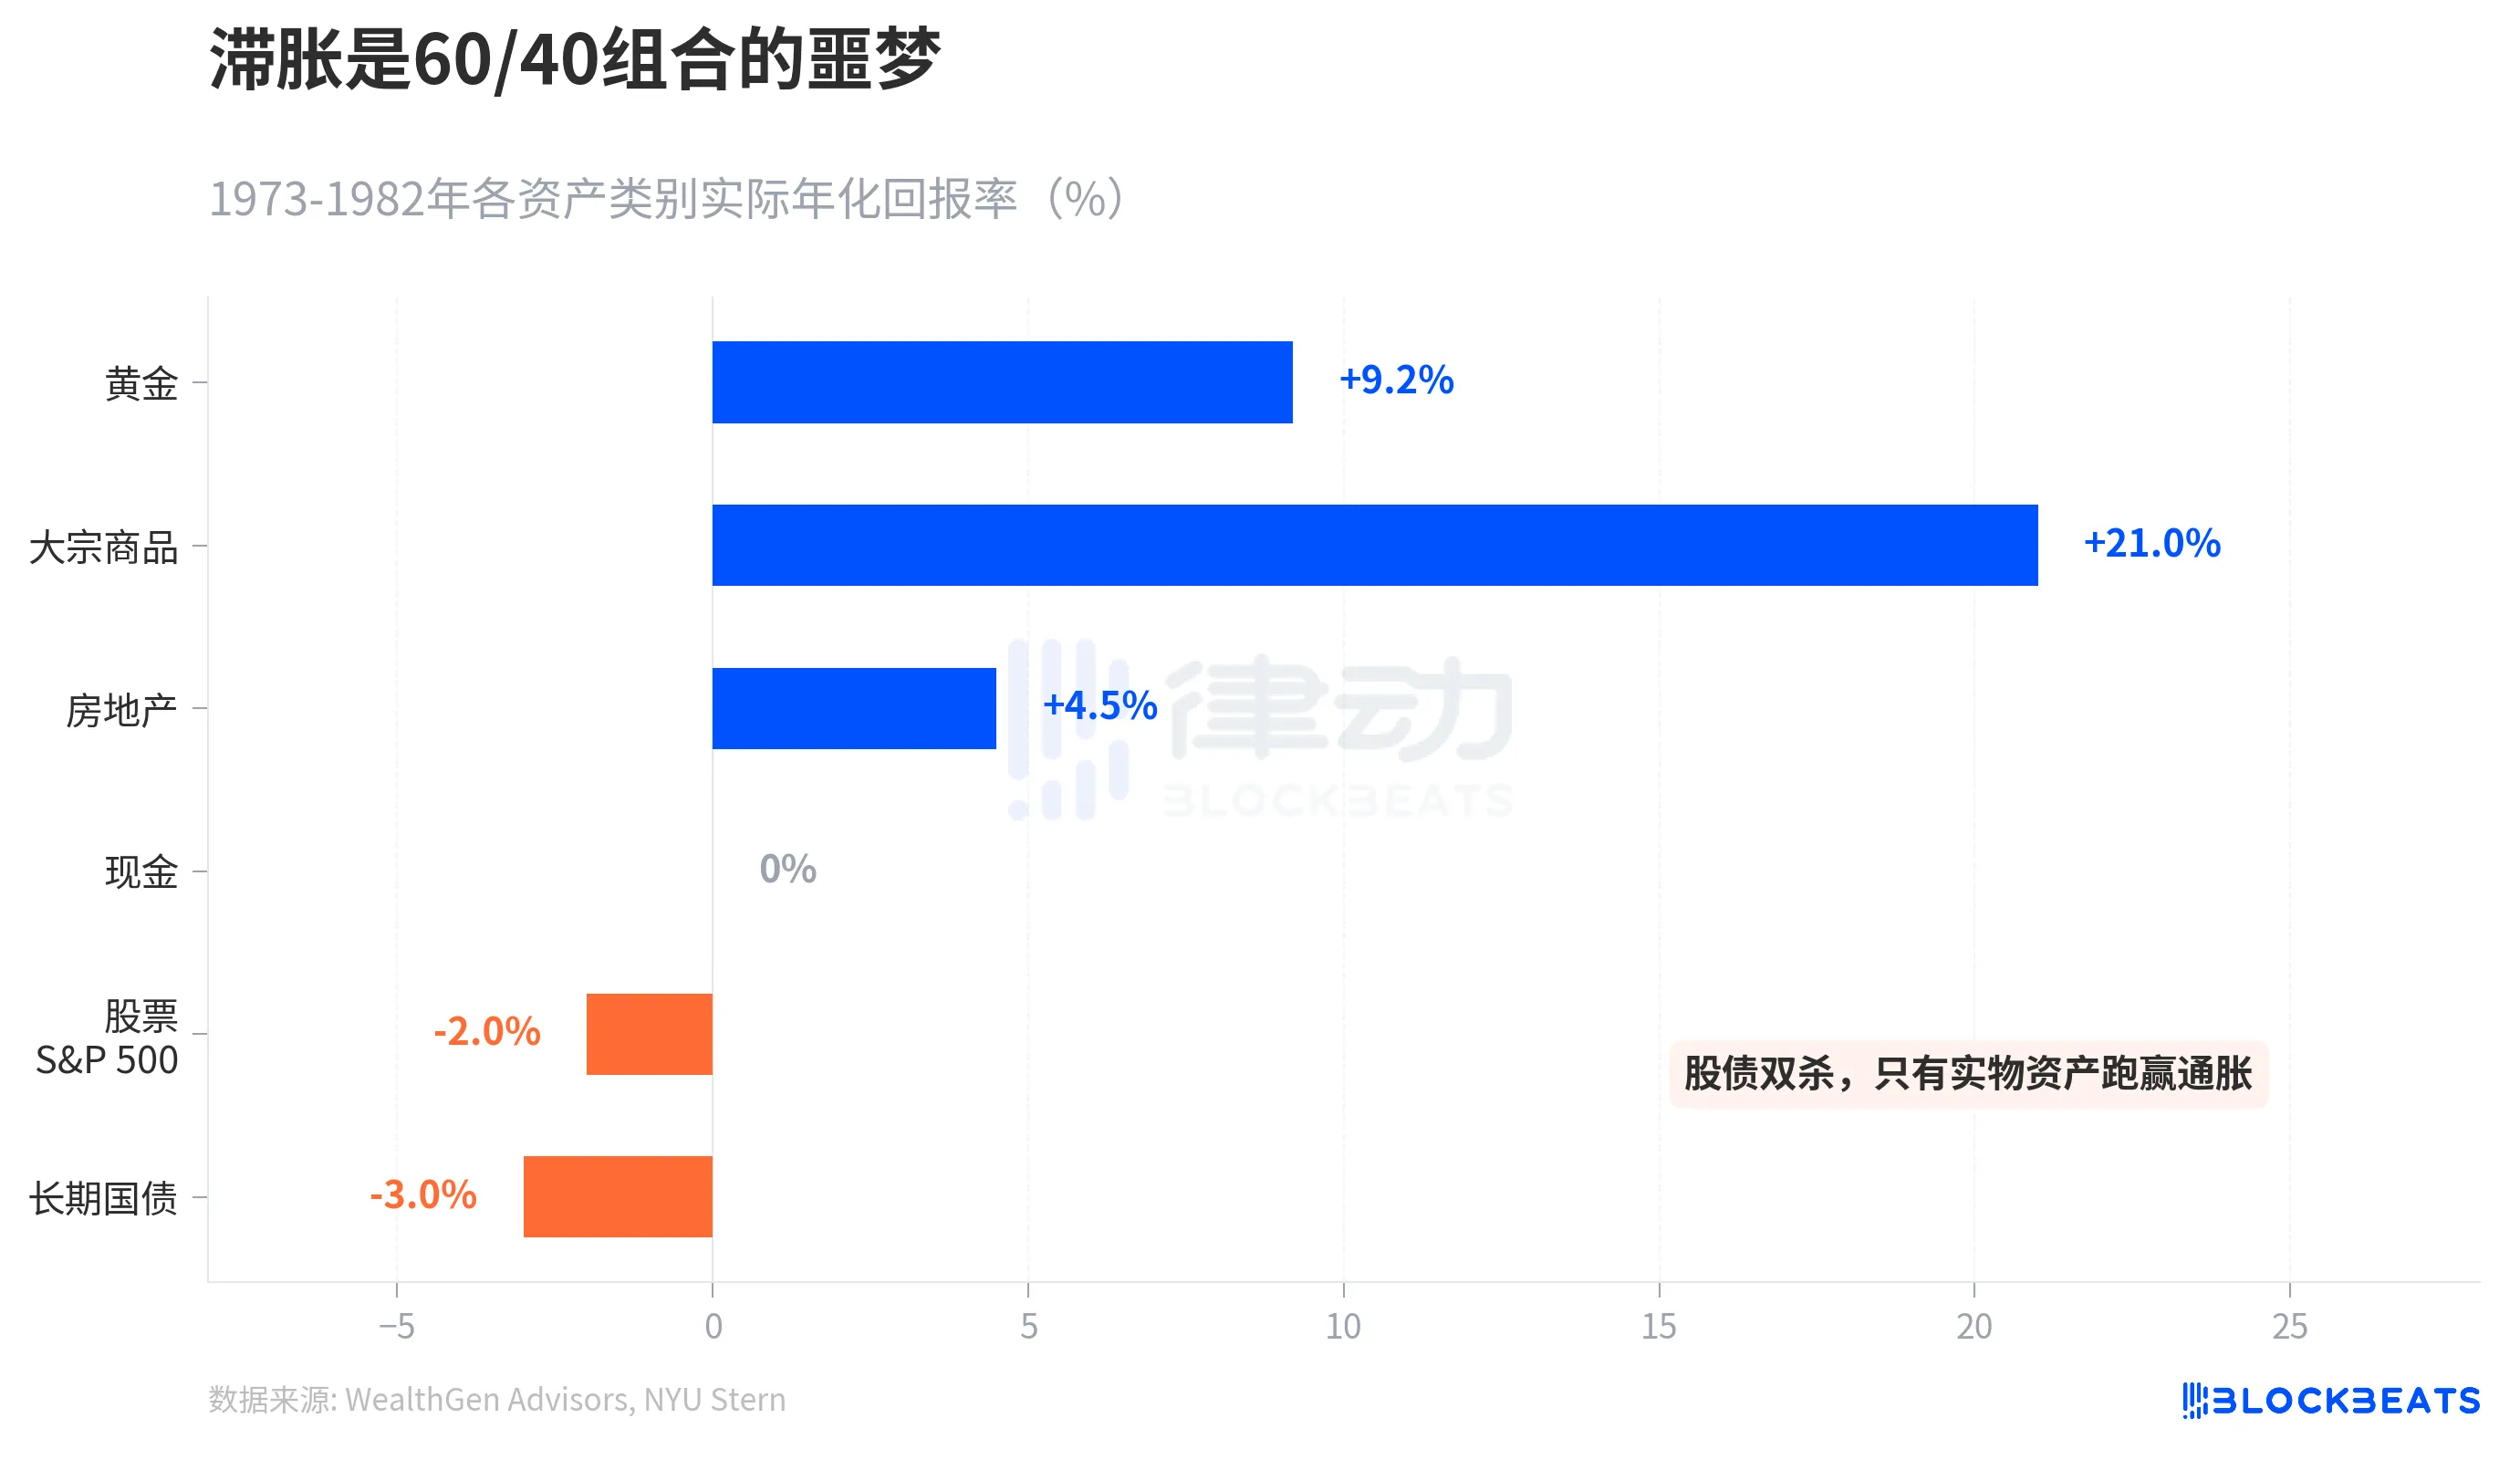
The era of high inflation from 1973 to 1982 provides an asset performance report. Gold's real annualized return was +9.2%, the S&P GSCI commodity index surged 586% over ten years, and real estate returned +4.5%. In contrast, the S&P 500 had a real annualized return of -2%, and long-term government bonds were at -3%. According to NYU Stern historical data, in 1979 alone, long-term government bonds suffered a loss as high as -8.6%.
A traditional 60/40 investment portfolio (60% stocks + 40% bonds) was crushed during stagflation. The only assets that could outpace inflation were tangible assets. Natixis predicts an April Brent average price of $125, with a "credible peak" reaching $150. Goldman Sachs, with a slightly milder outlook, forecasts an April average price of $115 but assumes the Houthis will restore navigation through the Strait of Hormuz within six weeks, falling back to $80 by the year-end.
The bond market has already made a one-time choice for everyone, betting on a recession over inflation.
You may also like
How the US-Iran War Could Affect Oil and Bitcoin Prices (Latest Analysis)
The outbreak of the US-Iran war on February 28, 2026, has provided an unprecedented real-time laboratory for understanding how geopolitical oil shocks interact with an increasingly institutionalized cryptocurrency market. This article examines the relationship between crude oil prices and Bitcoin throughout the conflict, analyzing price movements, correlation patterns, and the underlying transmission mechanisms.

OpenAI Wants to Write Its Own Rules|Rewire News Brief

Chaos Labs Exits, Who Will Pick Up Aave's Risk?
Stealthy Financial War? Iran Collects Strait Transit Fees in Stablecoin

OpenAlice: One Person, That's a Jane Street | Project Overview

The Small-Town Youth Labeling Big AI Models

Morning Report | Strategy increased its holdings by 4,871 BTC last week; Toss plans to develop its own blockchain and issue a native cryptocurrency; OpenAI's CFO privately questioned the timing of the IPO in 2026

Research: Stablecoins have a trading volume of 35 trillion a year, how much of it is real payment?

Galaxy Research: AI agents are giving rise to new species on the blockchain, how zero-human companies activate the financial flywheel

Data Research: How big is the liquidity gap between Hyperliquid and CME crude oil?

WEEX P2P now supports GHS, ETB & ZAR—Merchant Recruitment Now Open
To make crypto deposits easier, WEEX has officially launched its P2P trading platform and continues to expand fiat support. We're excited to announce that the Ghana Cedi (GHS), Ethiopian Birr (ETB) and South African Rand (ZAR) are now available on WEEX P2P!
Why Are GPU Prices Skyrocketing Out of Control?

How to Master Claude Cowork Completely?

70-Page Confidential Letter Alleges First Charge of 'Lying,' Altman Tells Board 'I Can't Change My Personality'
Is Altcoin Season Starting in 2026? What Traders Should Watch Now
Altcoin season signals are becoming clearer in 2026 as capital rotation across crypto markets accelerates. Here’s what traders should watch and how strategy-based participation is evolving in the current market cycle.
Bitcoin ETF Inflows in 2026: Impact on BTC Price and Crypto Market Trends
Bitcoin ETF inflows are reshaping BTC price trends and crypto market liquidity in 2026. See how institutional capital is influencing volatility, trading behavior, and portfolio allocation strategies across crypto markets.
Visa's Stablecoin Strategy: Cards, Settlement, and the Future

Stock Market Split
How the US-Iran War Could Affect Oil and Bitcoin Prices (Latest Analysis)
The outbreak of the US-Iran war on February 28, 2026, has provided an unprecedented real-time laboratory for understanding how geopolitical oil shocks interact with an increasingly institutionalized cryptocurrency market. This article examines the relationship between crude oil prices and Bitcoin throughout the conflict, analyzing price movements, correlation patterns, and the underlying transmission mechanisms.